


Virtus Scholar Platform monthly statistics

The editorial team of Virtus Interpress is delighted to present the report on the main indicators of our Virtus Scholar Statistics Platform. This platform provides the key statistical data of the papers published in our journals. We consider that the researches are to be shared them freely in the scholarly sphere. It is an important factor for our authors with regard to the paper’s citation, views and readability, etc. Also, this will enable the theoretical results to be practically applied in corporate governance. Our Platform Statistics is a part of our open access policy.
We introduce the results of our analysis concerning the views and downloads of the papers published in our journals in the previous month. The statistics is divided into 2 parts: Article Views Statistics (views data counts starting from March 2017) and Geographical Statistics (downloads data counts starting from August 2018).
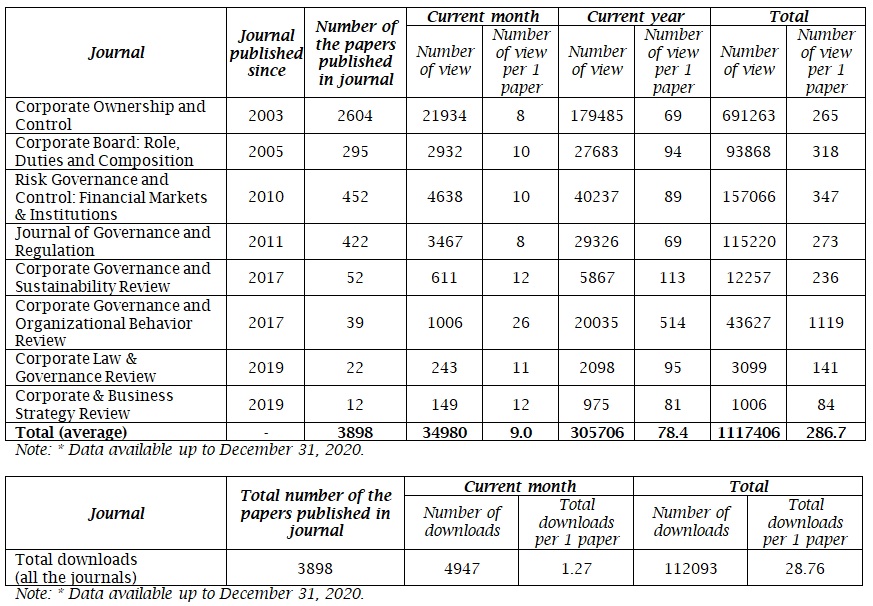
Firstly, according to the journal views, there is a positive dynamics. The total views of the papers published in our journals became in:
- the last month – 34980;
- the last year – 305706;
- all the time – 1117406.
As a result of the calculations, the number of views per 1 paper is:
- the last month – 9.0;
- the last year – 78.4;
- all the time – 286.7.
Thus, the total journal views rose by 37.63% for the last month, by 13.08% for the last year and by 3.27% for all the time compared to the month before. This indicates that the total views of the papers published in our journals are steadily increasing.
Secondly, according to the Platform Statistics, the total downloads of the papers published in our journals became in:
- the last month – 4947;
- all the time – 112093.
As a result of the calculations, the number of downloads per 1 paper is:
- the last month – 1.27;
- all the time – 28.76.
It is important to note that geographically our journal papers have been downloaded to read by scholars from all continents. Last month, papers were downloaded from 121 countries and for all the time – from 187 countries. The number of countries has increased by 1.08% for all the time compared with the month before.
Below are tables with calculating the indicators themselves, the number of views and downloads of papers published in our journals for December 2020:
Therefore, the results of the analysis display the positive dynamics of the journal views of papers published in our journals. The statistical data and our calculations confirmed it. All data based on the Platform Statistics and internal database.
We are going to keep our international scholarly network updated on the further changes in our Virtus Scholar Statistics Platform.


